Item Utilization Trend
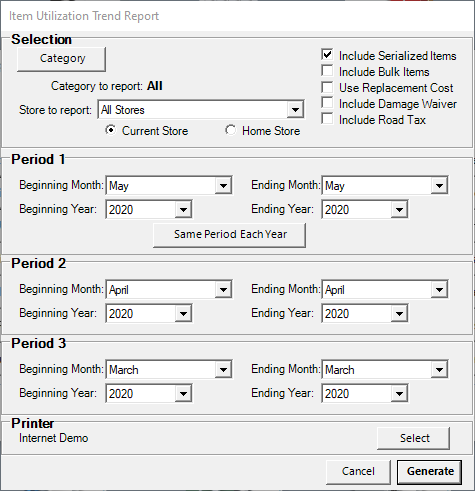
This analysis report shows utilization for three user defined periods. This report can be run for several months and uses the true hours in a month (ex 31 days=744 hrs) for the calculation, rather than a four week billing month (28 days =672 hrs). The report is grouped by store and by category. You can “drill down” on the report to get the details of each category, each header item and each item. The report gives the gross utilization and the weighted utilization (by inventory value) by groupings as well.
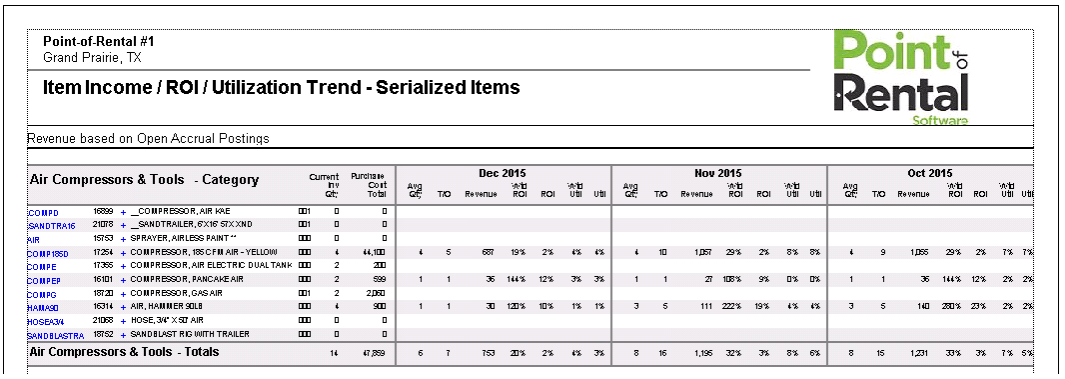
The report would look like the following:
Note: If ‘Capitalize Extra Charges’ is checked under the Accounting Tab in Parameters, then this report will also calculate including the extra costs.